When “Recovery” Becomes Harassment: My Ordeal With NeoGrowth’s Collection Agents — And Why the RBI Should Be Watching
I did not expect that being a few weeks behind on a loan repayment would turn into members of my…

Candlestick patterns are a form of technical analysis used by traders to predict future market movements. They are based on…
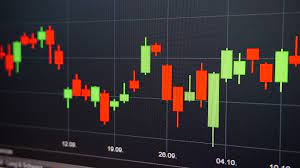
Candlestick patterns are a form of technical analysis used by traders to predict future market movements. They are based on past price actions. These patterns are especially useful for beginners as they provide visual cues that are easy to interpret.
Let’s learn basics of stock market by reviewing the widely used candlestick patterns in this article.
The Hanging Man is a bearish reversal candlestick pattern that often signals the end of an uptrend. Its distinguishing features include:
The pattern suggests that sellers could push prices down significantly during the trading period from the open, although the buyers managed to recover some ground by the close. The real body can be either red or green. This indicates a close below or above the open, respectively.
However, the key feature is the long lower shadow, which should be at least twice the length of the body. They reflect a significant sell-off during the session.
This is a bullish reversal signal in Japanese candlestick charting. It features a small body at the top, suggesting a narrow range between opening and closing prices.
The body has a long lower shadow that is at least double the length of the body itself. This represents a significant intraday sell-off, followed by a strong rebound. The absence or minimal presence of an upper shadow indicates that buyers maintained control as the session closed. While the body’s color is not crucial, a green body indicates stronger buying pressure.
The Engulfing pattern consists of two contrasting candles, with the second candle’s body completely covering or’ engulfing’ the first. In a Bullish Engulfing pattern, a smaller bearish (black or red) candle is followed by a larger bullish (white or green) candle. This suggests a potential upward trend shift.
Conversely, a Bearish Engulfing pattern features a smaller bullish candle succeeded by a larger bearish candle. These patterns are more reliable when they follow a consistent trend of four or more candles.
This one is a bullish reversal indicator. It is a three-candle formation in which the first candle is long bearish, indicating the decline’s continuation. The second candle is small and reflects market indecision and a potential change in direction. This candle may gap down from the first one.
The third candle is a large bullish candle that closes well within the body of the first candle and signals a shift in momentum from sellers to buyers.
It is a bearish candlestick pattern that signals a potential reversal of an uptrend. The pattern occurs within an established uptrend. Here is how.
Each candlestick opens higher than the previous day’s close and closes lower. The candles have long, real bodies and small or nonexistent upper shadows. This pattern suggests selling pressure is strong and persistent.
Trying different candlestick patterns in various market scenarios can help determine the potential trade. However, it is essential to remember that no pattern guarantees a particular market movement. Therefore, you should use candlestick patterns in conjunction with other analysis and risk management strategies. To learn more about candlestick patterns, you can enroll in Upsurge.club’s technical analysis course online.
Advertisement